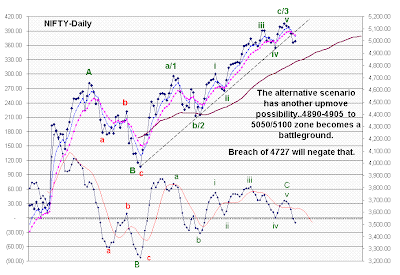
Illustrated here with "IOC" & "Nifty" chart:-
(I have chosen IOC as it is not manipulated, nevertheless widely traded in its sector)

 1. When the down trend is nearing its "oversold" &" public apathy" & "Panic" situation, you will notice a +ve div in the down move's 4th & 5th wave down OR in "b" & "c" down OR in "c4" & "c5", there by identifying the start of the 1 st wave.
2. First wave generally gets exhausted with the macd moving into +ve area and this can be fine tuned with the help of hour charts. In underperformers, macd may find it difficult to get into positive territory but moves closer to "0".
3. In the Second wave, macd moves back into negative once again. In outperformers, macd may stay above "0" but moves down closer to "0".
4. Third wave upmove takes macd strongly up to the extreme upsides. Then. in outperformers the macd may move down with prices continuing to move up and as the macd moves up again, prices move much higher. This is where the "novice" investors/ traders read the direction of the macd with prices quite literally and miss a huge upmove..Exhaustion in this uptrend can be gauged from the "gaps", "volume" as well as following the 3rd wave subdivisions in the "hourly charts".
5. Fourth wave moves become triangles to carry out time correction if the third wave was very steep and swift Or an alternation to the second wave(if 2nd is flat, then the 4th is zigzag and vice versa). In underperformers, the macd moves into negative while in outperformers it stays above "0" but comes well off its high reading to set itself for a negative divergence base.
6. Fifth wave or the "froth" or the "speculative move" will bring in mostly the retailers with a herd kind of move to new highs while the macd making a lower high thereby developing a negative divergence. In a strongly trending markets, the 5th wave gets extended with series of negative divergences frustrating the bears and confounding the bulls and the falls happen with a sudden reversal when complacency sets into bulls.
7. During the reversal, the first wave down takes the macd into negative territory and the second wave up into positive and the cycle repeats itself in the opposite direction.
Sounds simple..But as you watch the prices move on your monitor, you generally tend to forget all your lessons. Best EW practioners have "military discipline" in them..those who mean business ...be it in any phase/ aspect of life.
When a trading competition was held in the USA for EW practitioners, most of the toppers had military background which gave them the edge over others in carrying out the commands without questioning.
All the EW followers will admit that the most difficult part of EW practice is "to believe in what one sees" . Correct labeling of the charts once the moves are over for posterity is easy . Needless to say here that "you are right only when you make money" and that is "act when you should without questioning".
Continue Reading...
(I have chosen IOC as it is not manipulated, nevertheless widely traded in its sector)

 1. When the down trend is nearing its "oversold" &" public apathy" & "Panic" situation, you will notice a +ve div in the down move's 4th & 5th wave down OR in "b" & "c" down OR in "c4" & "c5", there by identifying the start of the 1 st wave.
2. First wave generally gets exhausted with the macd moving into +ve area and this can be fine tuned with the help of hour charts. In underperformers, macd may find it difficult to get into positive territory but moves closer to "0".
3. In the Second wave, macd moves back into negative once again. In outperformers, macd may stay above "0" but moves down closer to "0".
4. Third wave upmove takes macd strongly up to the extreme upsides. Then. in outperformers the macd may move down with prices continuing to move up and as the macd moves up again, prices move much higher. This is where the "novice" investors/ traders read the direction of the macd with prices quite literally and miss a huge upmove..Exhaustion in this uptrend can be gauged from the "gaps", "volume" as well as following the 3rd wave subdivisions in the "hourly charts".
5. Fourth wave moves become triangles to carry out time correction if the third wave was very steep and swift Or an alternation to the second wave(if 2nd is flat, then the 4th is zigzag and vice versa). In underperformers, the macd moves into negative while in outperformers it stays above "0" but comes well off its high reading to set itself for a negative divergence base.
6. Fifth wave or the "froth" or the "speculative move" will bring in mostly the retailers with a herd kind of move to new highs while the macd making a lower high thereby developing a negative divergence. In a strongly trending markets, the 5th wave gets extended with series of negative divergences frustrating the bears and confounding the bulls and the falls happen with a sudden reversal when complacency sets into bulls.
7. During the reversal, the first wave down takes the macd into negative territory and the second wave up into positive and the cycle repeats itself in the opposite direction.
Sounds simple..But as you watch the prices move on your monitor, you generally tend to forget all your lessons. Best EW practioners have "military discipline" in them..those who mean business ...be it in any phase/ aspect of life.
When a trading competition was held in the USA for EW practitioners, most of the toppers had military background which gave them the edge over others in carrying out the commands without questioning.
All the EW followers will admit that the most difficult part of EW practice is "to believe in what one sees" . Correct labeling of the charts once the moves are over for posterity is easy . Needless to say here that "you are right only when you make money" and that is "act when you should without questioning".