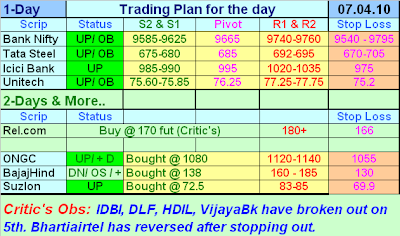
Friday, April 9, 2010

Trading opportunities

7 RULES ON IDENTIFYING INVESTMENT OPPORTUNITIES

Investors need to have rules. Without structure and order you are destined to fail. I always say you should invest or trade like a robot – without emotion and always adherent to your rules. I’ve attached some excellent rules on identifying investment opportunities by the always insightful Howard Marks at Oaktree Capital Management. For more details from myself on investing rules please see here and here:
* No group or sector in the investment world enjoys as its birthright the promise of consistent high returns.
There is no asset class that will do well simply because of what it is. An example of this is real estate. People said, “You should buy real estate because it’s a hedge against inflation,” and “You should buy real estate because they’re not making any more.” But done at the wrong time, real estate investing didn’t work.
* What matters most is not what you invest in, but when and at what price.
There is no such thing as a good or bad investment idea per se. For example, the selection of good companies is certainly not enough to assure good results — see Xerox, Avon, Merck and the rest of the “nifty fifty” in 1974.
Any investment can be good or bad depending on when it’s made and what price is paid. It’s been said that “any bond can be triple-A at a price. “There is no security that is so good that it can’t be overpriced, or so bad that it can’t be underpriced.
* The discipline which is most important in investing is not accounting or economics, but psychology.
The key is who likes the investment now and who doesn’t. Future prices changes will be determined by whether it comes to be liked by more people or fewer people in the future.Investing is a popularity contest, and the most dangerous thing is to buy something at the peak of its popularity. At that point, all favorable facts and opinions are already factored into its price, and no new buyers are left to emerge.
The safest and most potentially profitable thing is to buy something when no one likes it. Given time its popularity, and thus its price, can only go one way: up.Watch which asset classes they’re holding conferences for and how many people are attending. Sold-out conferences are a danger sign. You want to participate in auctions where there are only one or two buyers, not hundreds or thousands.You want to buy things either before they’ve been discovered or after there’s been a shake-out.
* The bottom line is that it is best to act as a contrarian.
An investment that “everyone” knows to be undervalued is an oxymoron. If everyone knows it’s undervalued, why haven’t they bought it and driven up its price? And if they have bought, how can the price still be low?
Yogi Berra said, “nobody goes to that restaurant; it’s too popular.” The equally oxy-moronic investment version is “Everybody likes that security because it’s so cheap.”
* Book the bet that no one else will.
If everyone likes the favorite in a football game and wants to bet on it, the point spread will grow so wide that the team — as good as it is — is unlikely to be able to cover the spread. Take the other side of the bet — on the underdog. Likewise, if everyone is too scared of junk bonds to buy them, it will become possible for you to buy them at a yield spread which not only overcompensates for the actual credit risk, but sets the stage for their being the best performing fixed income sector in the world. That was the case in late 1990. The bottom line is that one must try to be on the other side of the question from everyone else. If everyone likes it, sell; if no one likes it, buy.
* As Warren Buffet said, “the less care with which others conduct their affairs, the more care with which you should conduct yours.” When others are afraid, you needn’t be; when others are unafraid, you’d better be.
It is usually said that the market runs on fear and greed. I feel at any given point in time it runs on fear UorU greed.As 1991 began, everyone was petrified of high yield bonds. Only the very best bonds could be issued, and thus buyers at that time didn’t have to do any credit analysis — the market did it for them. Its collective fear caused high standards to be imposed. But when investors are unafraid, they’ll buy anything. Thus the intelligent investor’s workload is much increased.
* Gresham’s Law says “bad money drives out good.” When paper money appeared, gold disappeared. It works in investing too: bad investors drive out good.
When undemanding investors appear, they’ll buy anything. Underwriting standards fall, and it gets hard for demanding investors to find opportunities offering the return and risk balance they require, so they’re forced to the sidelines.Demanding investors must be willing to be inactive at times.
Source: Oaktree Capital Management.......Courtesy: Manoj Agarwal.
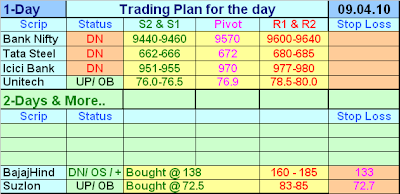
Continue Reading...

Thursday, April 8, 2010

Bank Nifty confirms a short term reversal..


Continue Reading...

Trading Opportunities.

Most of the stocks have still not closed below their 5-ema and hence trading levels are suggested. One could sell closer to the resistance levels and hold for few days.
Continue Reading...

Wednesday, April 7, 2010

Bank Nifty corrects after - ve div..


Continue Reading...

Trading & Investment opportunities

1. RIL 2. SBI
Continue Reading...

Tuesday, April 6, 2010

Bank Nifty shows a distinct -ve div..


Continue Reading...

Trading & Investment opportunities.

Continue Reading...

Monday, April 5, 2010

Bank Nifty's momentous move after closing above "High ema"...

A. Bank Nifty fell from 10774 to 3315 (A-wave) and the corrective "B-wave" is unfolding in "abc-x-abc" fashion. OR
B. Bank Nifty has completed a larger correction @ 3315 and it has resumed its bullish trend with impulsive waves. This impulse wave is in its 5th and will complete a larger wave.1 and commence a correction thereafter. In this scenario, the uptrend is capped @ 10700-10790 as the 3rd wave is smaller than the 1st.


Continue Reading...

Trading & Investment opportunities

Bank Nifty's MP values: VAH ----- 9511; POC ----- 9481;VAL ----- 9471
(Stay Long above 9510)

Rajeev Verma's Observations:-(aarvee9)

Range bound small daily movements of Nifty and approaching earnings seasons forced me to see some of the top traded counters .Here are some interesting observations.The method of analysis is described for scrutiny giving example of the first counter.

1.RCOM

Last closing price-.170.8

INDICATORS:

(a) Daily charts-

S.STOCHS(14,3) : Bullish above 50 mark after short dip.

S.STOCHS(5,3) : Moving above from near 20 mark, %K and %D bullishly aligned.

F.STOCH(5,3 : Bullish moving upwards,near 50

RSI(14) &RSI(9) : Both Bullish ,moving upwards yet to reach OB region.

MACD(26,12,9: MA and signal bullishly aligned and near zero mark ,Histogram is positive and flat.

EMA: Short term Ema’s , 5(169.2) and 20(166.5) are bullishly aligned with close above 5Ema, 20 ema and 50 ema(168.9) but below 100 dma at apprx.172.

PSAR : 164.5

BOLINGER BANDS: 157-174

CHART PATTERN: Closed on last trading day with a Doji candle. Inverted H & S pattern formed on daily charts with neckline at approx 173.

(b) Weekly charts-

STOCHS(14,3) are moving up from OS region, RSI (14) also moving up nearing 50 MACD (26,12,9) moving up towards zero mark with Histogram already positive and rising .Weekly Close is also above 5EMA(167.3).

The Pattern of Weekly close is also of a Doji candle.Larger pattern shows a Channel movement since Nov 09 with range of 161-194.

(c ) Derivates Data

Addition of 1.2 cr shares in Futures( total Open Interest of 1.89 cr) in rollover week between 22/3 to 25/3 with low price at 165 and high at 174NF.

CONCLUSION:

The counter is Bullish with Daily and Weekly indicators in line of the Bullish trend.A close above 100dma of 172,will be approx. break of bullish H&S neckline with potential target of aprrx. 192 ,which again will be Channel Top resistance of larger pattern. It looks a relatively safe bet with Stop loss of 164,which is the last swing low and futures low during rollover on a closing basis

2.TATA MOTORS.

Bullish ,with buy on a dip( since Daily Fast Stochs in OB condition) to 20ema (757) or 50ema(743),Options data also suggests bullishness with open interest change of 50% in 740 Put in last two trading days.Can go long with Stop loss of 740(which is also appx.50ema) with target as 820-25(resistance at downtrendline since Jan).

3.INFOSYS

Basic indicators are in Oversold condition or turning up from OS. If doesn’t give a double dip to 2600 and 5ema* 20 ema gets bullishly aligned,(bearishly aligned from last two days) can give a runup before and after results or alternatively can retrace to apprx 2700 levels (ie.a 33% of recent downmove )and again dip back after results.Options data suggest a cap at 2575-2600 levels on downside with approx 44000 shares(58%) added in 2650 Puts on 31/3.Can be a good play on both sides.

4.UNITECH

Bullish close above 5ema both in Daily and Weekly.All Basic Indicators moving from OS condition.The last close is also above 20 dema but resisted at 50 dema(75.5).Has also broken above a bullish Falling Wedge medium term Pattern since Oct’09.The rollover of this series was in the range of 71-75.So with a Stop loss of 71 on a closing basis can target 79-80 (appx 100dma and Bollinger band upper limit)

5.SUZLON

All Basic Indicators turning up from Oversold condition in Daily and the last close is also above 5ema.but 5 and 20 ema are bearishly aligned and also Weekly indicators are yet to reach OS condition.But as Daily indicators are turning up from OS and an important Support of apprx. Of 72 (support line joining lows from Nov’09)is near ,also the rollover range low is at 71.9NF, the counter can be played long with stoploss at 71 on closing basis for a target of 75-76(50ema).


Continue Reading...