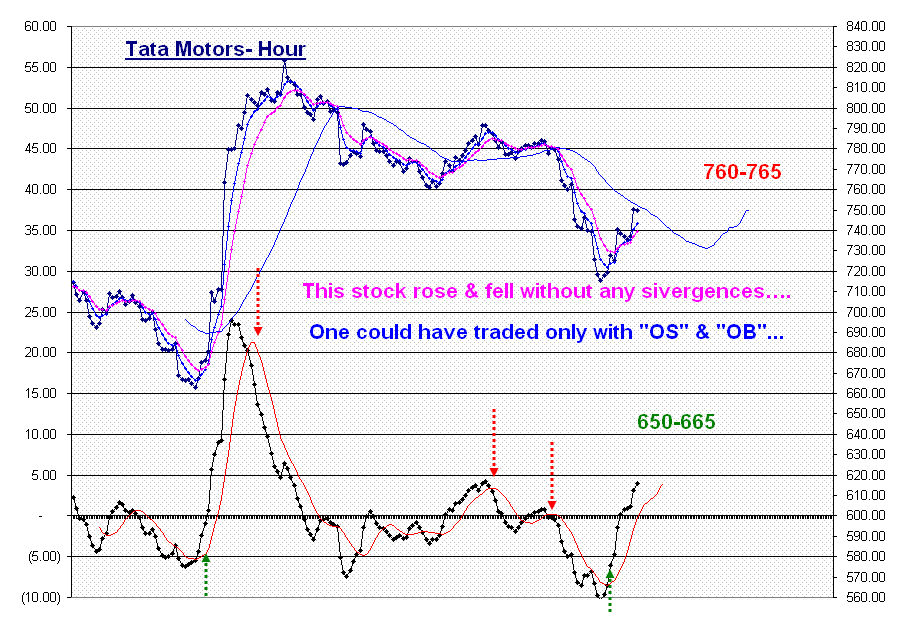
Satheesh's quest for knowledge should lead to some profitable trades....only with some patience and persistence..The trick will be to to take a step back and see the bigger picture. That is to see a daily chart and fit in the "hour" chart into it.
1. I credit lots of success to "EW study" but never in isolation. The success rate is good only because it is combined with TA.
2. "Divergences play" alone bring you the biggest riches time and again. The more pronounced they are, the more gains they get you. And when these divergences coincide with a "perceived completion of EW ", the conviction level in a trader goes high to hold on to that trade.
The two lows 4766(3rd wave) and 4675(5th wave) coincided with a clearly pronounced positive divergence and the result has been extraordinary.
Subsequent to that we have had one -ve div but that happened just after a steep rise and the oscillators showed -ve div but it is to "time adjust" the steepness in prices.
Currently a negative div. is developing but there is some "doubts" in the EW count. The strength in bank Nifty & certain stocks may cushion any falls. This one would test one's patience and one should remember the main trend and its trending up within the channel.
3. Macd defines the "Moving average convergence and divergence". One of the potent steep move indications has often come from watching the short term moving averge converging towards a medium term average (Here we have taken 35hour/ 5-day & 70 Hour/10-day sma) and then start to turn away slowly without touching or just touching the medium term average and thus setting up a "fast rise" scenario.This set up often concludes the "corrective or sideways" scenario and commencement of the next up move.
4. For the trend followers, a continuation of Higher high(HH) and Higher Low (HL) will indicate the continuation of trend and they can simple hold on to their position till this set up changes to LH & LL.


Continue Reading...
1. I credit lots of success to "EW study" but never in isolation. The success rate is good only because it is combined with TA.
2. "Divergences play" alone bring you the biggest riches time and again. The more pronounced they are, the more gains they get you. And when these divergences coincide with a "perceived completion of EW ", the conviction level in a trader goes high to hold on to that trade.
The two lows 4766(3rd wave) and 4675(5th wave) coincided with a clearly pronounced positive divergence and the result has been extraordinary.
Subsequent to that we have had one -ve div but that happened just after a steep rise and the oscillators showed -ve div but it is to "time adjust" the steepness in prices.
Currently a negative div. is developing but there is some "doubts" in the EW count. The strength in bank Nifty & certain stocks may cushion any falls. This one would test one's patience and one should remember the main trend and its trending up within the channel.
3. Macd defines the "Moving average convergence and divergence". One of the potent steep move indications has often come from watching the short term moving averge converging towards a medium term average (Here we have taken 35hour/ 5-day & 70 Hour/10-day sma) and then start to turn away slowly without touching or just touching the medium term average and thus setting up a "fast rise" scenario.This set up often concludes the "corrective or sideways" scenario and commencement of the next up move.
4. For the trend followers, a continuation of Higher high(HH) and Higher Low (HL) will indicate the continuation of trend and they can simple hold on to their position till this set up changes to LH & LL.