Showing posts with label Negative Divergence play. Show all posts

Wednesday, May 5, 2010

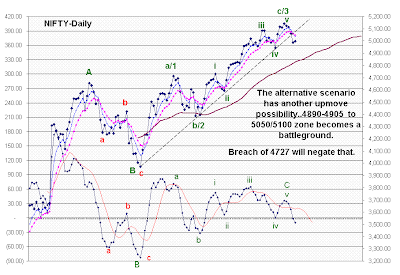
Bank Nifty pulls back after a double top break.

Continue Reading...

Sunday, March 28, 2010

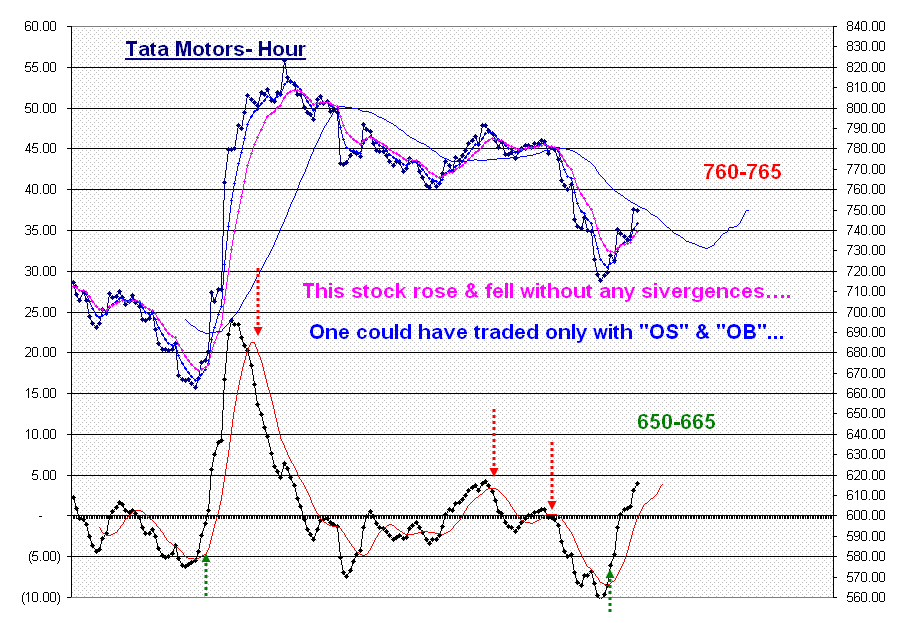
Applying Divergences with Hour time frame.

Satheesh's quest for knowledge should lead to some profitable trades....only with some patience and persistence..The trick will be to to take a step back and see the bigger picture. That is to see a daily chart and fit in the "hour" chart into it.
1. I credit lots of success to "EW study" but never in isolation. The success rate is good only because it is combined with TA.
2. "Divergences play" alone bring you the biggest riches time and again. The more pronounced they are, the more gains they get you. And when these divergences coincide with a "perceived completion of EW ", the conviction level in a trader goes high to hold on to that trade.
The two lows 4766(3rd wave) and 4675(5th wave) coincided with a clearly pronounced positive divergence and the result has been extraordinary.
Subsequent to that we have had one -ve div but that happened just after a steep rise and the oscillators showed -ve div but it is to "time adjust" the steepness in prices.
Currently a negative div. is developing but there is some "doubts" in the EW count. The strength in bank Nifty & certain stocks may cushion any falls. This one would test one's patience and one should remember the main trend and its trending up within the channel.
3. Macd defines the "Moving average convergence and divergence". One of the potent steep move indications has often come from watching the short term moving averge converging towards a medium term average (Here we have taken 35hour/ 5-day & 70 Hour/10-day sma) and then start to turn away slowly without touching or just touching the medium term average and thus setting up a "fast rise" scenario.This set up often concludes the "corrective or sideways" scenario and commencement of the next up move.
4. For the trend followers, a continuation of Higher high(HH) and Higher Low (HL) will indicate the continuation of trend and they can simple hold on to their position till this set up changes to LH & LL.


Continue Reading...

Saturday, October 24, 2009

How to combine EW with macd

Illustrated here with "IOC" & "Nifty" chart:-
(I have chosen IOC as it is not manipulated, nevertheless widely traded in its sector)
1. When the down trend is nearing its "oversold" &" public apathy" & "Panic" situation, you will notice a +ve div in the down move's 4th & 5th wave down OR in "b" & "c" down OR in "c4" & "c5", there by identifying the start of the 1 st wave.
2. First wave generally gets exhausted with the macd moving into +ve area and this can be fine tuned with the help of hour charts. In underperformers, macd may find it difficult to get into positive territory but moves closer to "0".
3. In the Second wave, macd moves back into negative once again. In outperformers, macd may stay above "0" but moves down closer to "0".
4. Third wave upmove takes macd strongly up to the extreme upsides. Then. in outperformers the macd may move down with prices continuing to move up and as the macd moves up again, prices move much higher. This is where the "novice" investors/ traders read the direction of the macd with prices quite literally and miss a huge upmove..Exhaustion in this uptrend can be gauged from the "gaps", "volume" as well as following the 3rd wave subdivisions in the "hourly charts".
5. Fourth wave moves become triangles to carry out time correction if the third wave was very steep and swift Or an alternation to the second wave(if 2nd is flat, then the 4th is zigzag and vice versa). In underperformers, the macd moves into negative while in outperformers it stays above "0" but comes well off its high reading to set itself for a negative divergence base.
6. Fifth wave or the "froth" or the "speculative move" will bring in mostly the retailers with a herd kind of move to new highs while the macd making a lower high thereby developing a negative divergence. In a strongly trending markets, the 5th wave gets extended with series of negative divergences frustrating the bears and confounding the bulls and the falls happen with a sudden reversal when complacency sets into bulls.
7. During the reversal, the first wave down takes the macd into negative territory and the second wave up into positive and the cycle repeats itself in the opposite direction.

Sounds simple..But as you watch the prices move on your monitor, you generally tend to forget all your lessons. Best EW practioners have "military discipline" in them..those who mean business ...be it in any phase/ aspect of life.
When a trading competition was held in the USA for EW practitioners, most of the toppers had military background which gave them the edge over others in carrying out the commands without questioning.
All the EW followers will admit that the most difficult part of EW practice is "to believe in what one sees" . Correct labeling of the charts once the moves are over for posterity is easy . Needless to say here that "you are right only when you make money" and that is "act when you should without questioning".
Continue Reading...

Thursday, October 22, 2009

Banking stocks - the Bogus last rise....

"Mayur" asked: -I am trying to understand Elliot Wave and was looking at the Banking Stocks in Particular.
SBI
ICICI Bank
Axis
SBI as we had discussed earlier has completed 5 and is downward.
Is my understanding Correct that ICICI & Axis have completed 3 and are on downward 4?
Also how do these waves of the stocks link with that of the Market / Nifty? What I meant to ask is assuming that the Nifty has completed 5 whereas these stocks have complete 3 though the Nifty comes downward ABC will these stocks attempt 5 upward once the 4 is complete?

My reply: Always read the EW along with macd, you could figure them out fairly easily. And forget about 5s or 3s as during a corrective rally, each stock & indices will behave differently. An "abc" corrective rally can have either "5-3-5" or "3-3-3" or "3-3-5" and more too.
Same chart can be counted differently by two persons. Combine TA, Sentiments, etc, you can then sense the irrational exhuberance on the streets that "Many years of misdeeds" could be rectified in "one statement from the rulers"....Let us not kid ourselves with news but let us get serious with prices..

This "Bogus rally" is not reserved for Banking sector alone, it is there in most of the sectors. Only sector which might swim against will be "IT sector" but even that is "Overbought". Sometimes "OB" stocks can remain "OB" for long too. But when negative divergences persist, take your money and reverse your trades. What other "signals" are we waiting for..?
I can go on posting chart after chart with such negative divergences..


Continue Reading...